Debt maturity profile
Debt maturity profile as of 31 December 2023*
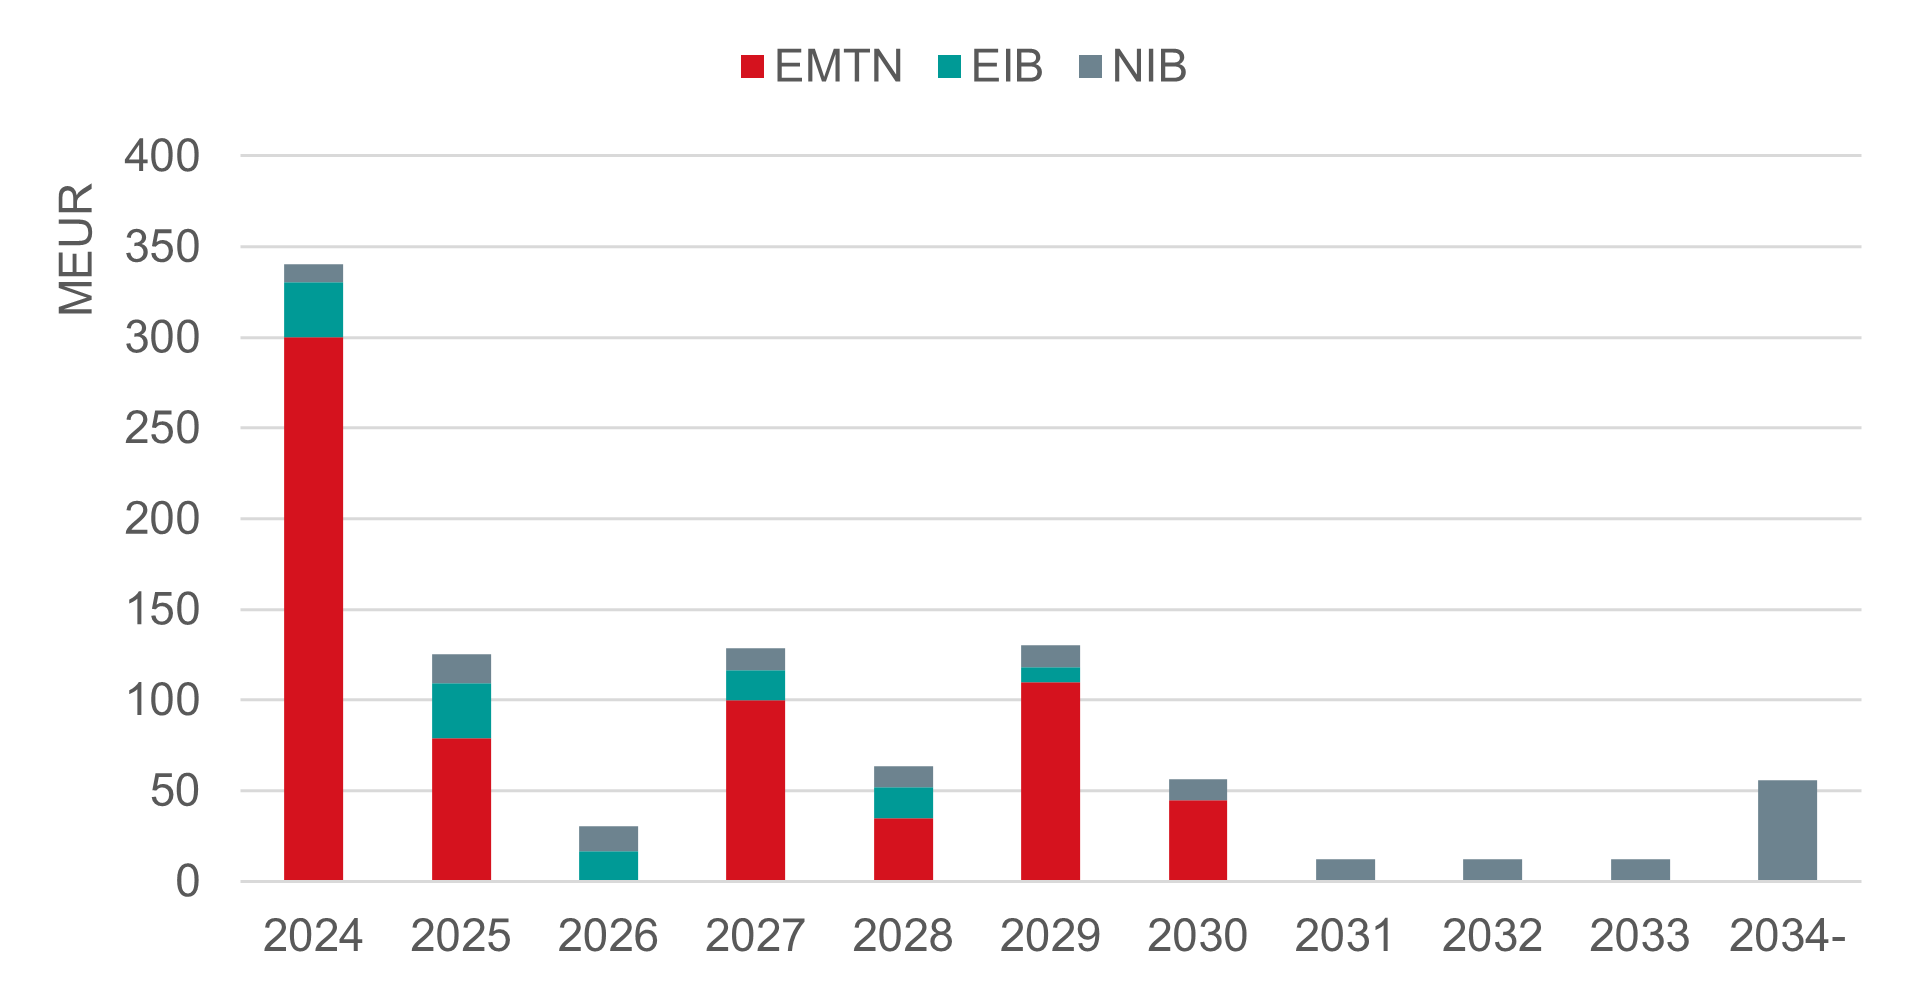
*Lease liabilities according to IFRS 16 not included
| Short term debt |
35 %
|
MEUR 340
|
|---|---|---|
| Long term debt |
65 %
|
MEUR 627
|
| Total gross debt |
MEUR 967
|
|
| MEUR | EMTN | ECP | EIB | NIB |
| 2024 | 300 | 0 | 31 | 10 |
| 2025 | 79 | 0 | 31 | 16 |
| 2026 | 0 | 0 | 17 | 14 |
| 2027 | 100 | 0 | 17 | 12 |
| 2028 | 35 | 0 | 17 | 12 |
| 2029 | 110 | 0 | 8 | 12 |
| 2030 | 44 | 0 | 0 | 12 |
| 2031 | 0 | 0 | 0 | 12 |
| 2032 | 0 | 0 | 0 | 12 |
| 2033 | 0 | 0 | 0 | 12 |
| 2034- | 0 | 0 | 0 | 56 |