Excellent results for Fingrid yet again in the international ITOMS study
ITOMS (International Transmission Operations & Maintenance Stydy) assesses the effectiveness of maintenance by electricity transmission system operators. Fingrid was the only company in the study to be named as Top Performer for both transmission lines and substations.
Comprehensive information on participating companies’ grid ownership, labour costs of maintenance, operational disturbances and maintenance practices is collected every other year for the ITOMS study. The assessments from this round apply to operations in 2018. Fingrid was the only company in the study to be named as Top Performer for both transmission line and substation maintenance categories.
The study included 29 network operators from around the world, such as Central Europe and Asia.
Fingrid has been successful in the international study for years
Fingrid has participated in the ITOMS study since 1995, ranking as one of its Top Performers from the beginning. Fingrid’s exceptionally long-standing success in the study has attracted lots of international attention. Fingrid has been praised especially for its professional organisation, which focuses on core competence, and for its well-optimised supply chain management. Investments in information systems, digitalisation and other new practices have also contributed to the success.
Fingrid participates in the study to promote best practices in the company’s operations. Moreover, participating in the study contributes to maintaining the efficiency of the transmission system operator and improving its operations, and provides an opportunity to compare operations with other similar operators.
Additional information:
Timo Kiiveri, Senior Vice President tel. +358 40 543 3039
email firstname.lastname@fingrid.fi
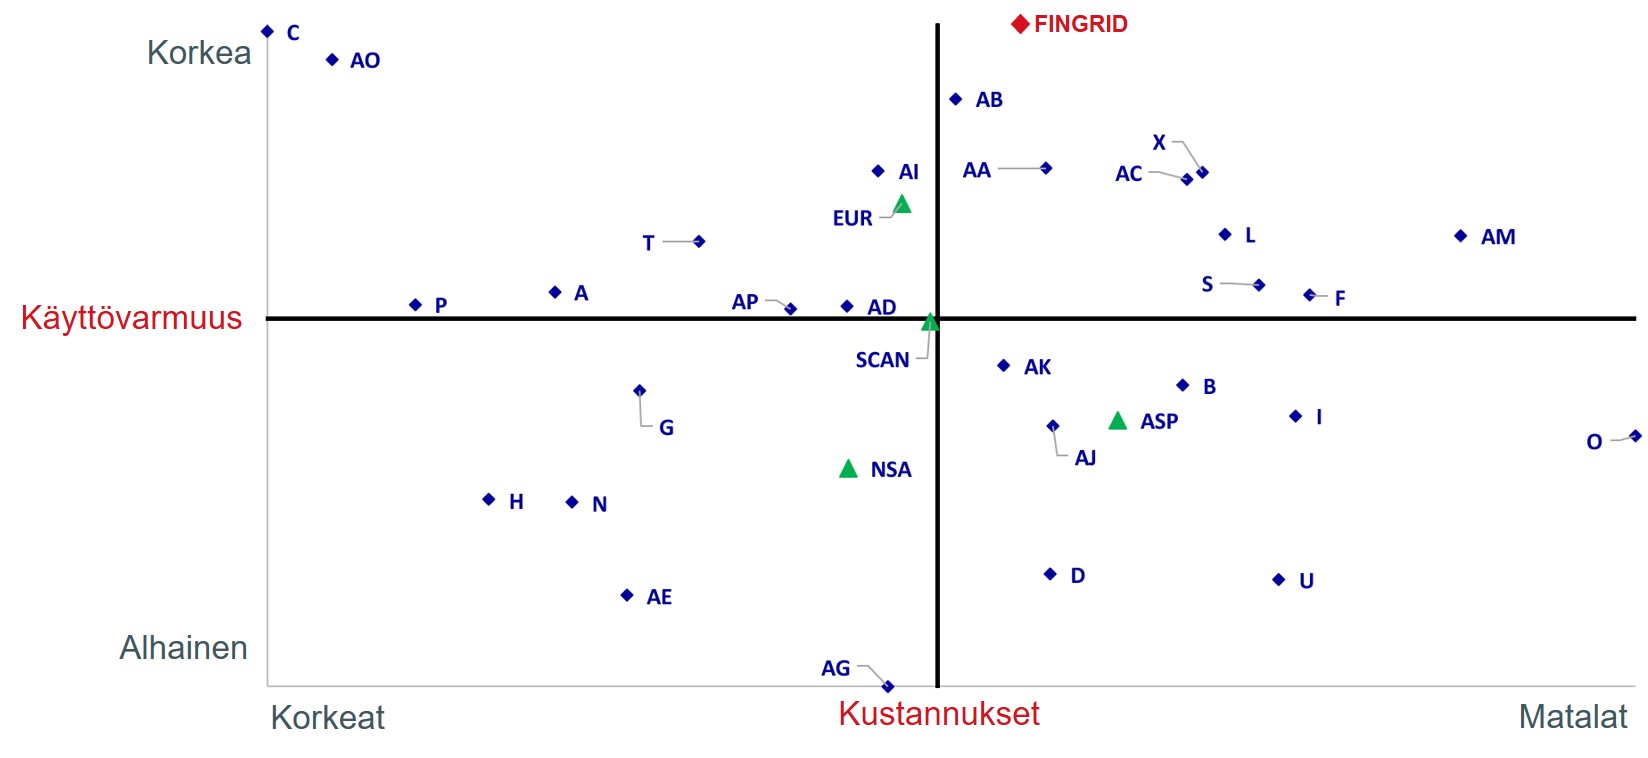
Figure (in Finnish) attached to the bulletin:
Weighted overall results of the ITOMS study. The vertical axis illustrates operational reliability (high at the top, low at the bottom) while the horizontal axis illustrates expenses (high on the left, low on the right). The participating companies have been depicted as dots on the graph and named using random acronyms. Fingrid’s result has been highlighted with a red dot and text. Fingrid is in the upper right quadrant of the graph, where expenses are below average and operational reliability is above average.